Tectonic setting.
Southern Mexico is a very interesting area where the subducting Cocos slab drastically changes its geometry: from a flat slab in Central Mexico to a ~ 45° dip angle beneath Chiapas. Also, the currently active volcanic arc, the modern Chiapanecan volcanic arc, is oblique and situated far inland from the Middle America trench, where the slab depth is ~ 200 km.
In contrast, the Central America volcanic arc is parallel to the Middle America trench and the slab depth is ~ 100 km. A 2D steady state thermo-mechanical model explains the calc-alkaline volcanism by high temperature (~ 1300° C) in the mantle wedge just beneath the Central America volcanic arc and strong dehydration (~ 5 wt.%) of the Cocos slab.
The origin of the modern Chiapanecan volcanic arc.
In contrast, the thermal model for the modern Chiapanecan volcanic arc shows high P-T conditions beneath the coast where the Miocene Chiapanecan extinct arc is present, and is therefore unable to offer a reasonable explanation for the origin of the modern Chiapanecan volcanic arc.
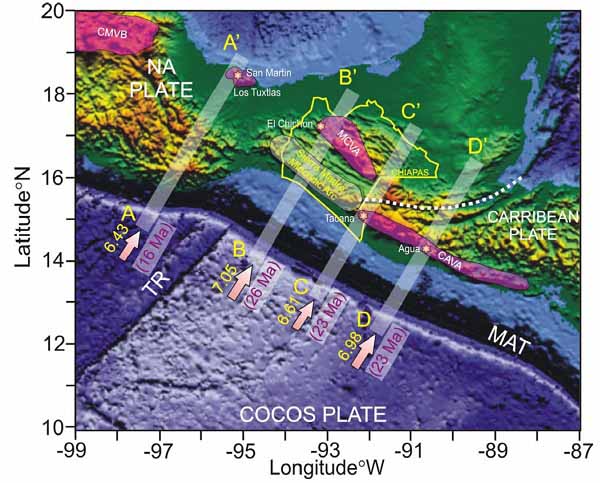
Figure 1. Generalized tectonic map of the study area. Tectonic setting and position of the four modeled cross-sections (straight transparent lines). Transparent red zones show the location of active volcanic belts in Mexico and Guatemala: CMVB – Central Mexican Volcanic Belt, TVF – Los Tuxtlas Volcanic Front, MCVA – Modern Chiapanecan Volcanic Arc, CAVA – Central American Volcanic Arc, MAT — Middle American Trench, TR – Tehuantepec Ridge. Transparent gray area: the extinct Sierra Madre Miocenic Arc. Orange stars are the main active volcanoes on each cross-section. Arrows show convergence velocities (above the arrows) between the Cocos and North American and Carribean plates (DeMets et al., 1994). The Cocos plate ages are shown beneath the arrows (Manea at al. 2005-C; Kanjorsky, 2003; Klitgord and Mammerickx, 1982).
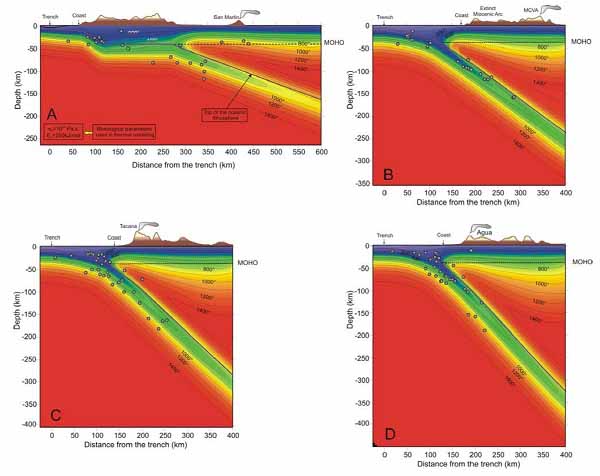
Figure 2. Steady-state thermal models with strong temperature-dependent viscosity in the mantle wedge for the four cross-section shown in Figure 1. The rheological parameters used are: a reference viscosity of 1020 Pa s and activation energy for olivine of 250 kJ/mol (Manea et al., 2004). Notice the high temperature beneath the active volcanic arcs (1200-1300° C) except for profile B-B’. The earthquakes with magnitudes, Mw>5.5, are represented by the black dots (compilation from: Rebollar et al., 1999; Engdahl and Villaseñor, 2002). Horizontal black dashed line shows the Moho. Topography is represented with 10x vertical exaggeration.
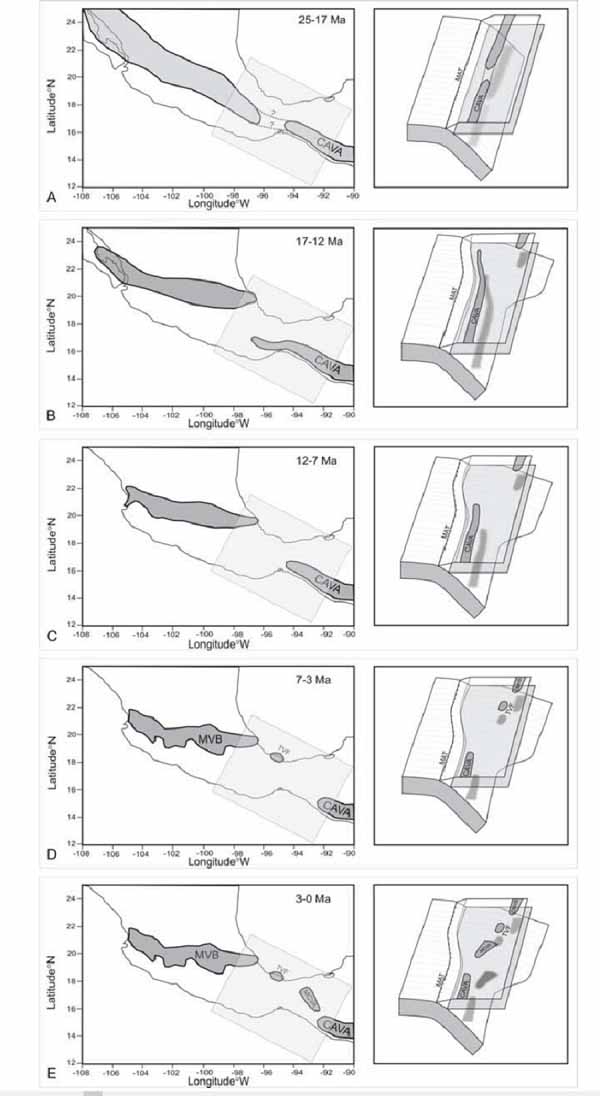
Figure 3. Space-time distribution of the volcanic arcs in Central and South Mexico (data from Ferrari et al., 1999; Damon and Montesinos, 1978).
A/ 25 – 17 Ma: the volcanic arc formed an approximatively continuous belt.
B/ 17 – 12 Ma: the CMVB moved inland, suggesting that the subducting slab become subhorizontal.
C/ 12 – 7 Ma: the flattening process of the Cocos slab continued further SE. The proximity of the new cold flat subducting lithosphere with the hot mantle wedge beneath Chiapas, would eventually lead to a progressively CAVA extinction in southern Mexico.
D/ 7 – 3 Ma: the CAVA continued to retreat SE and the volcanic activity close to the Chiapas coast ceased completely. Also, the TVF is born during this period.
E/ 3 – 0 Ma: The up bending of the subducting slab for the last 14 Ma created an asthenospheric inflow from NW to SW, which finally lead to the onset of the MCVA.
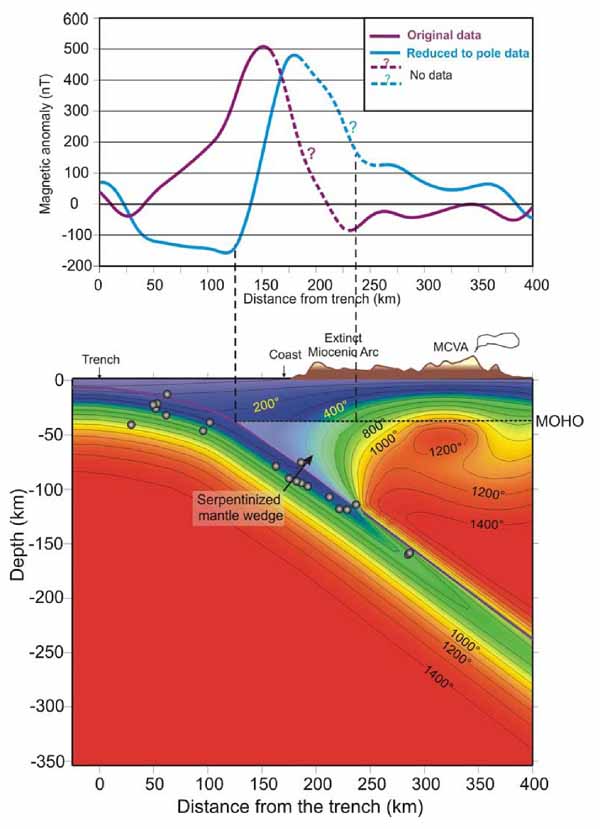
Figure 4. A/ Red line: Low pass filtered aeromagnetic anomaly along profile B-B’. Blue line is the same aeromagnetic anomaly but migrated to the pole, so the source is just beneath the peak. Dashed lines represent our extrapolation where real data is missing.
B/ Steady-state thermal model with a cold mantle wedge tip and a hot asthenospheric region beneath MCVA. The foggy triangle represents the serpentinized mantle wedge. Note the good corelation with the position of the pole migrated aeromagnetic anomaly.
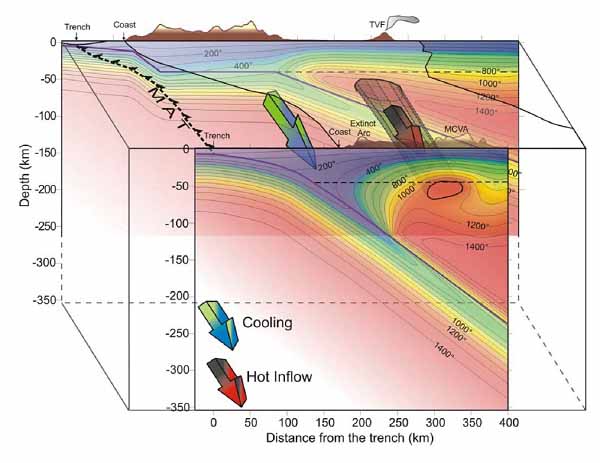
Figure 5. 3D conceptual model where can be seen that the mantle wedge beneath Chiapas lies just in front of a cold area which corresponds to the incoming flat slab. Also the hot asthenospheric inflow is shown.
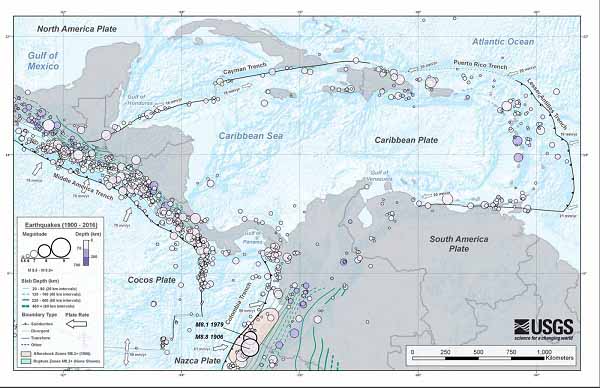
The Gulf of Tehuantepec lies above the convergent boundary where the Cocos Plate is being subducted below the North American Plate at a rate of 6.4 cm/yr (2.5 in/yr).