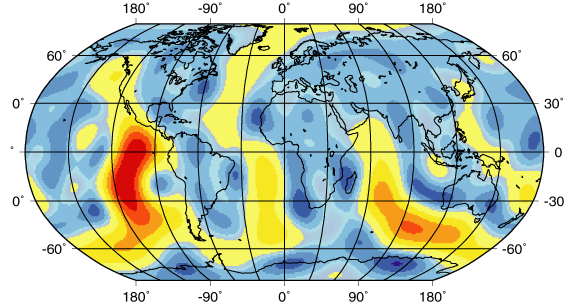
Measuring heat flow at different points on Earth's surface by measuring the change in temperature with depth (a higher temperature gradient indicates higher heat flow, assuming that the measurements were made in the same material). The map shown below is from the work of Pollack and Others (Reviews of Geophysics, 1983). Variations in the heat-flow measurements were averaged to provide a mathematical representation of Earth's heat flow. Individual measurements in any region can be different from the values plotted, but the regional averages are well represented in the map.
The average continental heat flow is about 57 milliwatts per square meters, the oceanic heat flow is about 100 milliwatts per square meters. The "warm" colors yellow-orange-red indicate higher than average heat flow, the blues are lower. As you can see, the heat flow is greatest along the system of mid-ocean ridges. Further, the location of the high heat-flow regions correlates with shallow regions of shallow ocean depth (ridges on the sea floor) and the location of earthquakes - supporting evidence confirming the basic ideas behind plate tectonics.
Because global coverage of heat flow measurements is still poor in many areas, empirical estimators based on the geology, the thermotectonic age or the velocity structure of the upper mantle have often been used to affect an estimate to regions where such measurements are absent.

