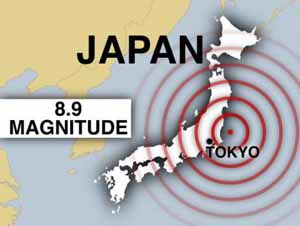
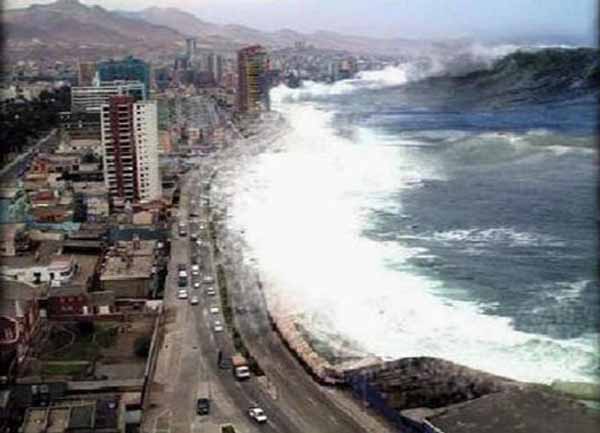
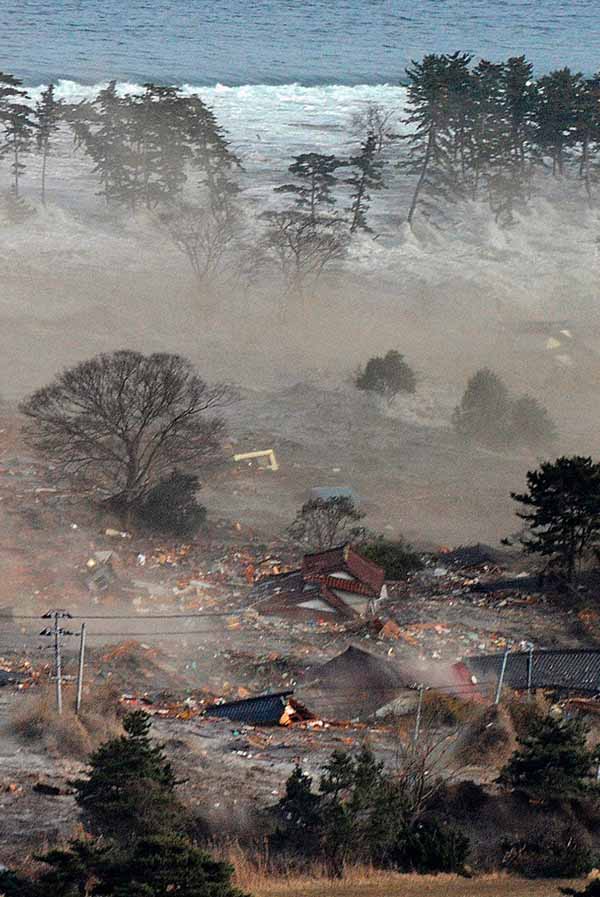
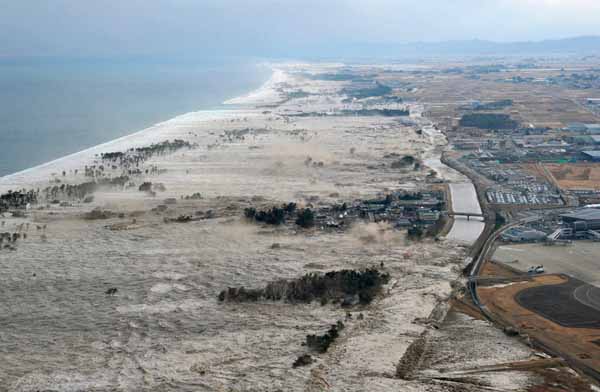
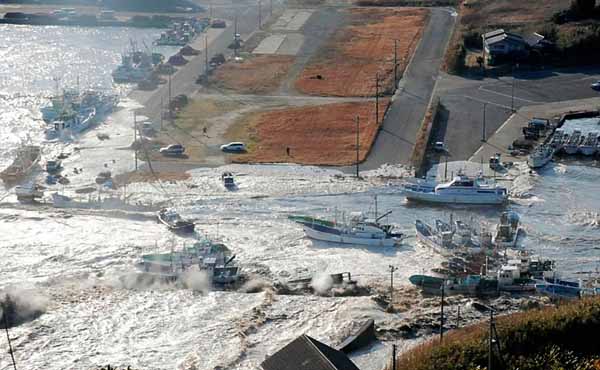
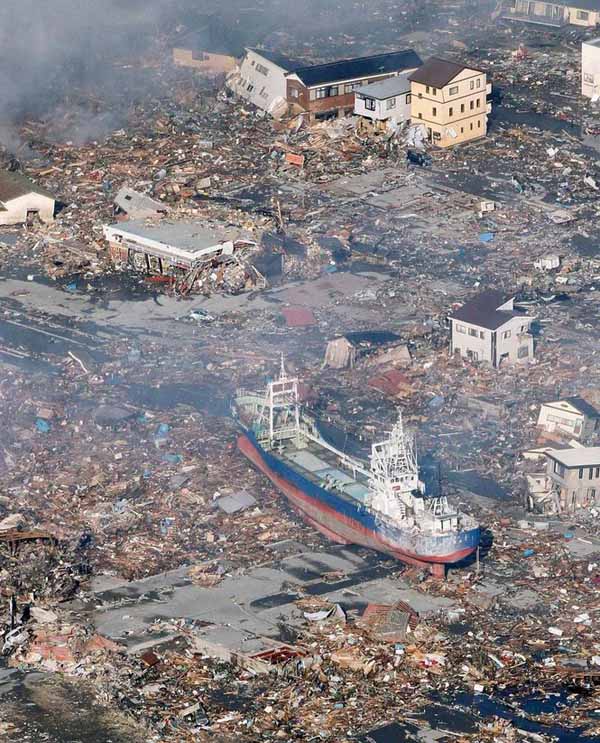
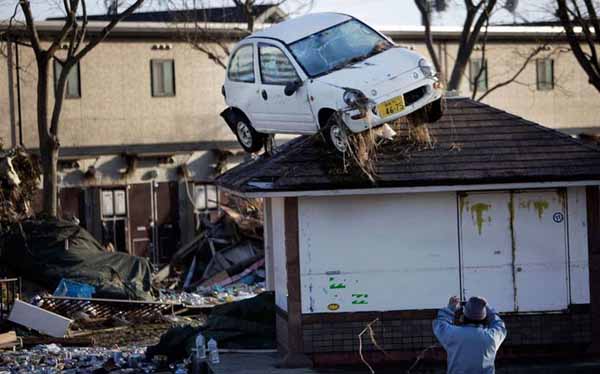
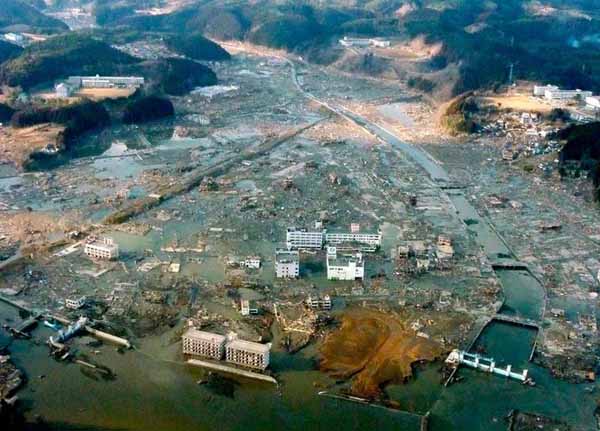
The 2011 Sendai earthquake and tsunami occurred at 14:46 JST (05:46 UTC) on 11 March 2011. The epicenter was reported to be 130 kilometers (81 mi) off the east coast of the Oshika Peninsula, Tohoku, with the hypocenter at a depth of 24.4 km (15.2 mi). The earthquake triggered tsunami warnings and evacuations along Japan's Pacific coast and in at least 20 countries, including the entire Pacific coast of North America and South America. The earthquake created extremely destructive tsunami waves of up to 10 meters (33 ft) that struck Japan minutes after the quake, with smaller waves after several hours in many other countries.
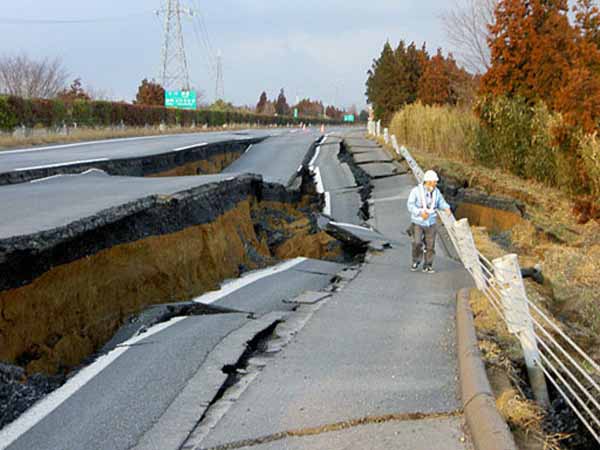
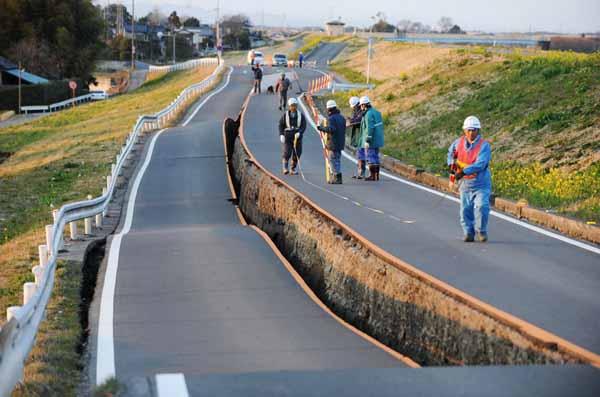
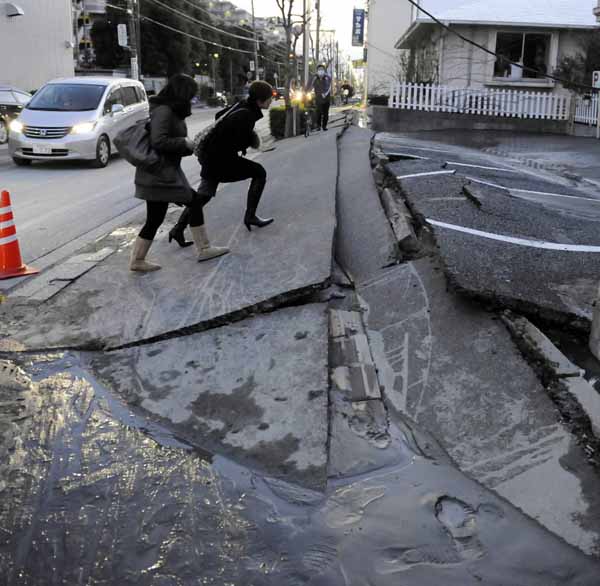
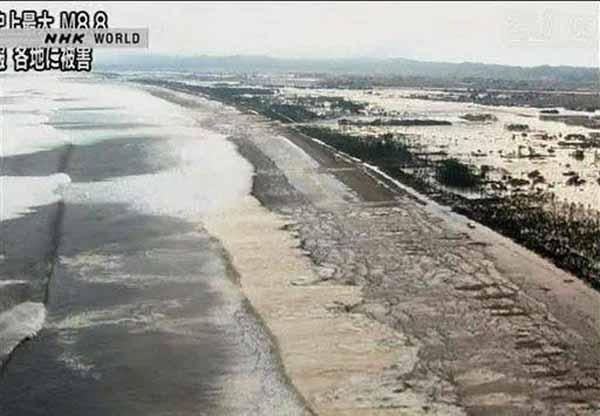
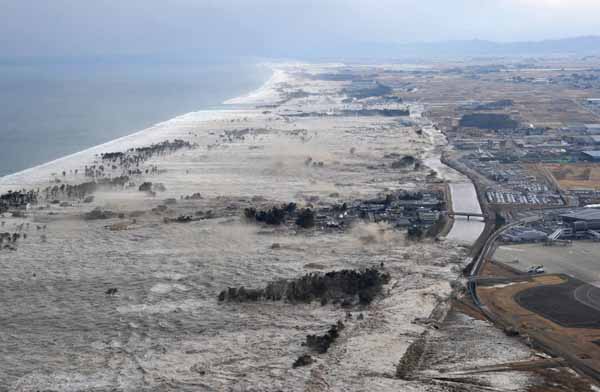
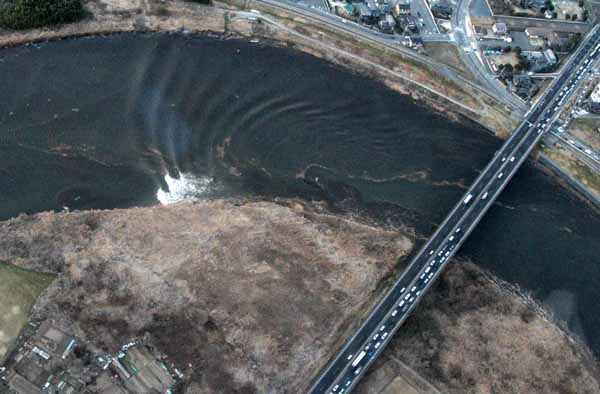
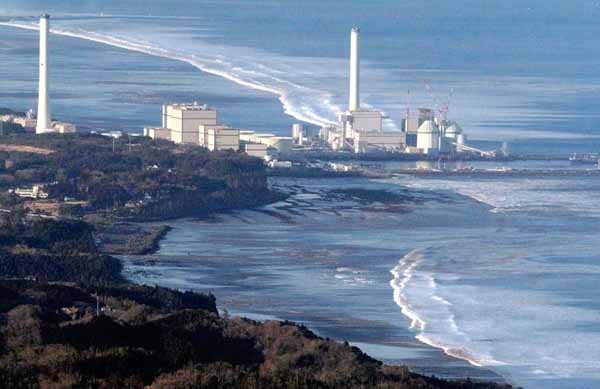
In Japan, the waves are reported to have travelled up to 10 km (6 mi) inland. The earthquake and tsunami caused extensive and severe damage in Japan, including heavy damage to roads and railways as well as fires in many areas, and a dam collapse. Many electrical generators were taken down, and at least two nuclear reactors partially melted down.
The estimates of the Sendai earthquake's magnitude made it the most powerful earthquake to hit Japan and one of the five most powerful earthquakes in the world overall since modern record-keeping began in 1900.
The record of the M8.9 earthquake that occurred near the east coast of Honshu, Japan on the University of Portland seismometer (UPOR) is illustrated below. Portland is about 7427 km (4615 miles, 66.91°) from the location of this earthquake. Following the earthquake, it took 10 minutes and 50 seconds (650 seconds) for the compressional P-waves to travel a curved path through the mantle from Japan to Portland. PP-waves are compressional waves that bounce off the Earth’s surface halfway between the earthquake and the station. PP energy arrived 13 minutes and 17 seconds (797 seconds) after the earthquake. S and SS are shear waves that follow the same path through the mantle as P and PP waves, respectively. The S-waves arrived 19 minutes and 42 seconds (1182 seconds) and SS-waves arrived 24 minutes and 2 seconds (1442 seconds) after the earthquake. Surface wave energy required approximately 28 minutes and 18 seconds (1698 seconds) to travel the 7427 km (4615 miles) around the perimeter of the Earth from Japan to Portland, Oregon.
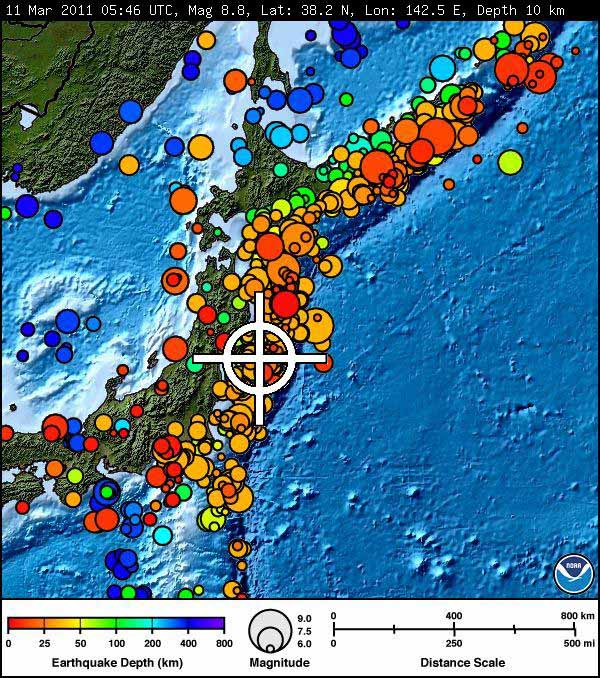
This earthquake (gold star), plotted with regional seismicity since 1990, occurred at approximately the same location as the March 9, 2011M 7.2 earthquake. In a cluster, the earthquake with the largest magnitude is called the main shock; anything before it is a foreshock and anything after it is an aftershock. A main shock will be redefined as a foreshock if a subsequent event has a larger magnitude.This earthquake redefines the M 7.2 earthquake as a foreshock, with this event replacing it as the main shock.
This earthquake was preceded by a series of large foreshocks over the previous two days, beginning on March 9th with an M 7.2 event approximately 40 km from the March 11 earthquake, and continuing with 3 earthquakes greater than M 6 on the same day. The M8.9 earthquake has been followed by frequent large aftershocks, which can do damage on their own especially to buildings that were compromised in the main shock.
Aftershock sequences follow predictable patterns as a group, although the individual earthquakes are themselves not predictable. The graph below shows how the number of aftershocks and the magnitude of aftershocks decay with increasing time since the main shock. The number of aftershocks also decreases with distance from the main shock. Aftershocks usually occur geographically near the main shock. The stress on the main shock's fault changes drastically during the main shock and that fault produces most of the aftershocks. Sometimes the change in stress caused by the main shock is great enough to trigger aftershocks on other, nearby faults.
This earthquake was the result of thrust faulting along or near the convergent plate boundary where the Pacific Plate subducts beneath Japan. This map also shows the rate and direction of motion of the Pacific Plate with respect to the Eurasian Plate near the Japan Trench. Note that some authors divide this region into several microplates that together define the relative motions between the larger Pacific, North America and Eurasia plates; these include the Okhotsk and Amur microplates that are respectively part of North America and Eurasia.
The rate of convergence at this plate boundary is about 83 mm/yr (8 cm/year). This is a fairly high convergence rate and this subduction zone is very seismically active.
At the latitude of this earthquake, the Pacific plate moves approximately westwards with respect to the Eurasian plate at a velocity of 83 mm/yr. The Pacific plate thrusts underneath Japan at the Japan Trench, and dips to the west beneath Eurasia. The location, depth, and focal mechanism of the March 11 earthquake are consistent with the event having occurred as thrust faulting associated with subduction along this plate boundary.
Shaded areas show quadrants of the focal sphere in which the P-wave first-motions are away from the source, and unshaded areas show quadrants in which the P-wave first-motions are toward the source. The dots represent the axis of maximum compressional strain (in black, called the "P-axis") and the axis of maximum extensional strain (in white, called the "T-axis") resulting from the earthquake.
Subduction zones are the flip side of mid-ocean ridges in plate tectonics. They are destructive plate boundaries - sites where it is inferred that plates are taken back down into the asthenosphere. The evidence for their existence largely comes from seismology.
Earthquake focal depths pick out zones of faulting passing from the ocean trenches down over 600 km into the mantle. These are called Wadati-Benioff zones after the two geophysicists who independently established the pattern of earthquakes. These earthquake zones coincide with panels of anomalously high seismic velocities (high velocities are generally thought to represent cold mantle) suggesting plates diving down. Computer models can predict the temperature structure of subduction zones and indicate that the downgoing slab can be many hundreds of degrees cooler than the surrounding mantle. The dip of Wadati-Benioff zones are hugely variable.
3.1. Seismic Imaging Some (Japan B-B)Subduction Zone. Seismic Tomography.
Examples of depth cross sections in several subduction zone areas showing
fast anomalies associated with subducted slabs as revealed by P travel time tomography
using ISC data (from Karason & van der Hilst 2000). B-B – Japan subduction zone.
Maps of the subduction zone areas around Japan at different depths in the
transition zone showing lateral variations in velocity obtained in a “high resolution” P
velocity model [top, WEPP2 (Obayashi et al. 1997)] compared to those obtained in a “long wavelength” S model [bottom, SAW12D (Li & Romanowicz 1996)].
A tsunami is a series of water waves (also called a tsunami wave train) caused by the displacement of a large volume of a body of water, usually an ocean. Tsunamis are a frequent occurrence in Japan Owing to the immense volumes of water and the high energy involved, tsunamis can devastate coastal regions. Earthquakes and other mass movements have the potential to generate a tsunami.
Tsunamis can be generated when the sea floor abruptly deforms and vertically displaces the overlying water. Tectonic earthquakes are a particular kind of earthquake that are associated with the earth's crustal deformation; when these earthquakes occur beneath the sea, the water above the deformed area is displaced from its equilibrium position. More specifically, a tsunami can be generated when thrust faults associated with convergent or destructive plate boundaries move abruptly, resulting in water displacement, owing to the vertical component of movement involved. Movement on normal faults will also cause displacement of the seabed, but the size of the largest of such events is normally too small to give rise to a significant tsunami.
1.2.3.
4.
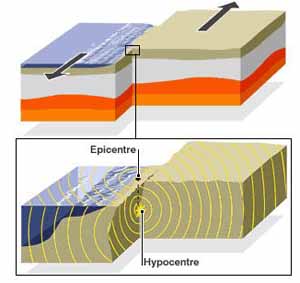
1. Vertical Slice Through a Subduction Zone (Drawing of tectonic plate boundary before earthquake). One of the many tectonic plates that make up Earth’s outer shell descends, or “subducts,” under an adjacent plate. This kind of boundary between plates is called a “subduction zone.” When the plates move suddenly in an area where they are usually stuck, an earthquake happens. 2. Between Earthquakes (Overriding plate bulges under strain, causing tectonic uplift). Stuck to the subducting plate, the overriding plate gets squeezed. Its leading edge is dragged down, while an area behind bulges upward. This movement goes on for decades or centuries, slowly building up stress. 3. During an Earthquake (Plate slips, causing subsidence and releasing energy into water). An earthquake along a subduction zone happens when the leading edge of the overriding plate breaks free and springs seaward, raising the sea floor and the water above it. This uplift starts a tsunami. Meanwhile, the bulge behind the leading edge collapses, thinning the plate and lowering coastal areas. 4. Minutes Later (The energy released produces tsunami waves). Part of the tsunami races toward nearby land, growing taller as it comes in to shore. Another part heads across the ocean toward distant shores.
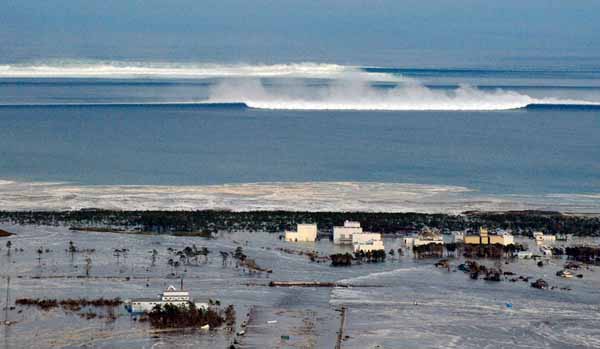
1. When the wave enters shallow water, it slows down and its amplitude (height) increases.
2. This tsunami propagation forecast model shows the forecast maximum tsunami wave height (in cm). Ocean floor bathymetry affects the wave height because a tsunami moves the seawater all the way to the floor of the ocean.This led to a Pacific wide tsunami warning being issued.
3. Projected travel times for the arrival of the tsunami waves across the Pacific.Nearby the earthquake there are only minutes to evacuate. However, in many other regions there is advance warning.A tsunami map shows projected travel times for the Pacific Ocean. This map indicates forecasted times only, not that a wave traveling those distances has actually been observed.
Sources of information:
1. Karason, H. and R. D. van der Hilst, (2000) Constraints on mantle convection from seismic tomography, in The History and Dynamics of Global Plate Motion, vol. 121, p. 277-288.
2. Li, X.-D., and B. Romanowicz (1996). Global mantle shear velocity model developed using nonlinear asymptotic coupling theory, J. Geophys. Res. 101, 22,245–22,272.
3. Obayashi M, Fukao Y. 1997. P and PcP travel time tomography for the core-mantle boundary. J. Geophys. Res. 102:17,825–41
4. Romanowicz, B., 2003. Global mantle tomography: progress status in the last 10 years, Annu. Rev. Geophys. Space Phys, 31, 303–328.
2. Websites:
- http://en.wikipedia.org
- http://pubs.usgs.gov
- http://earthquake.usgs.gov
- http://www.boston.com/bigpicture
- http://ptwc.weather.gov
- ftp://hazards.cr.usgs.gov
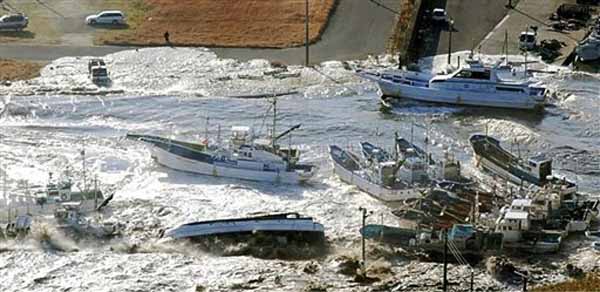
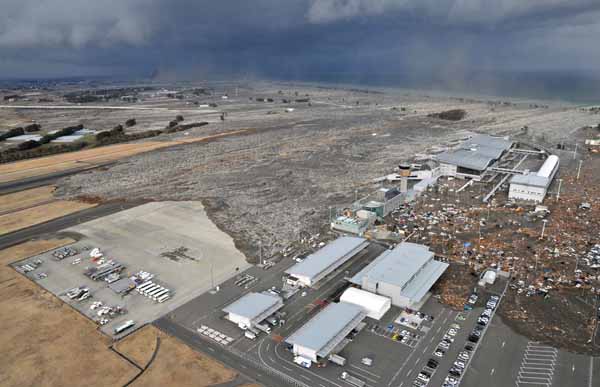
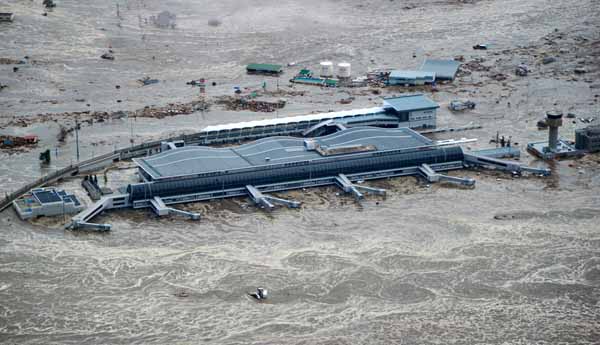
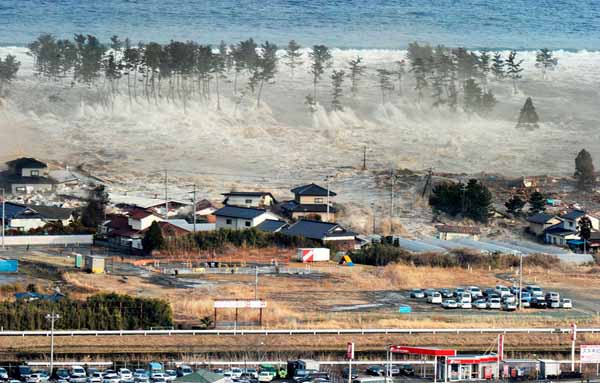
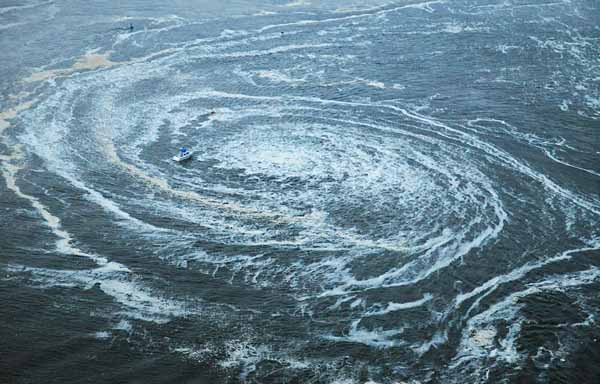
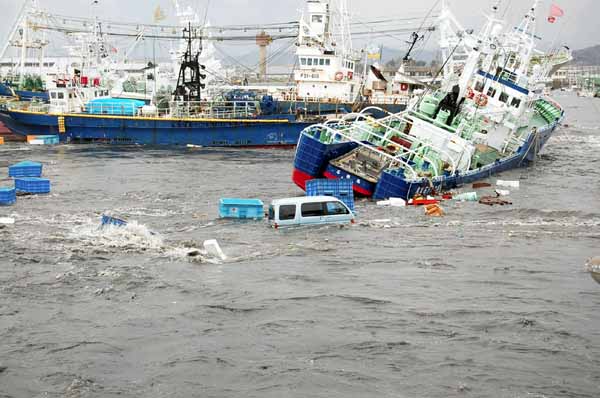
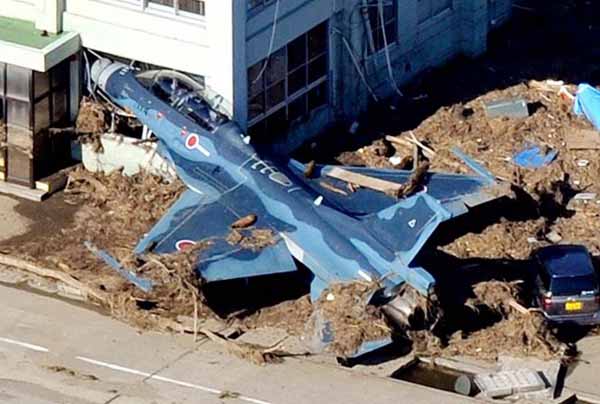
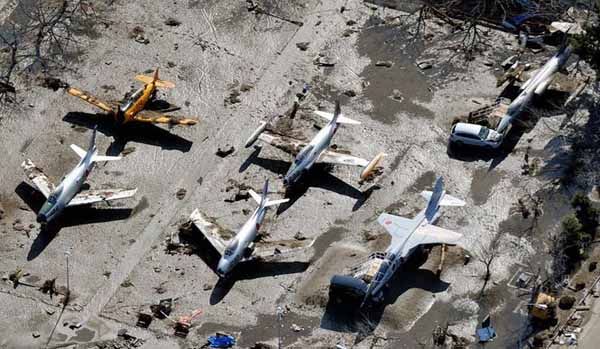
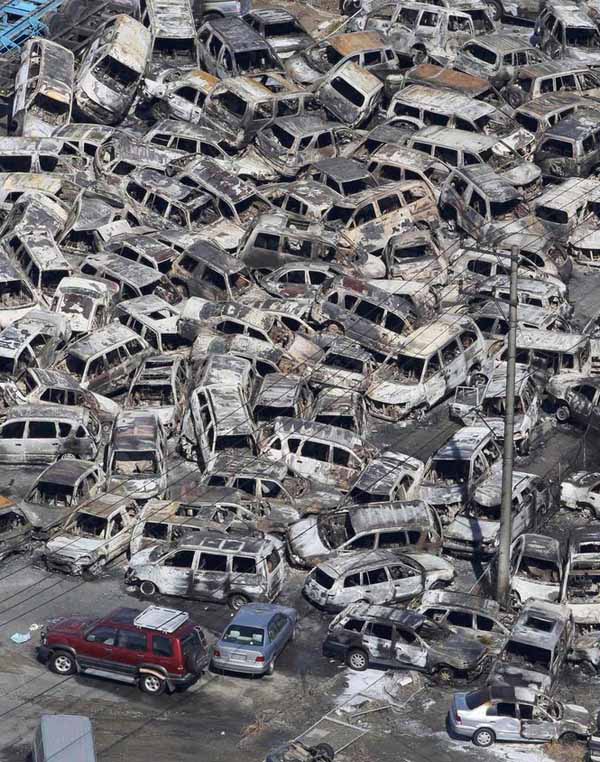
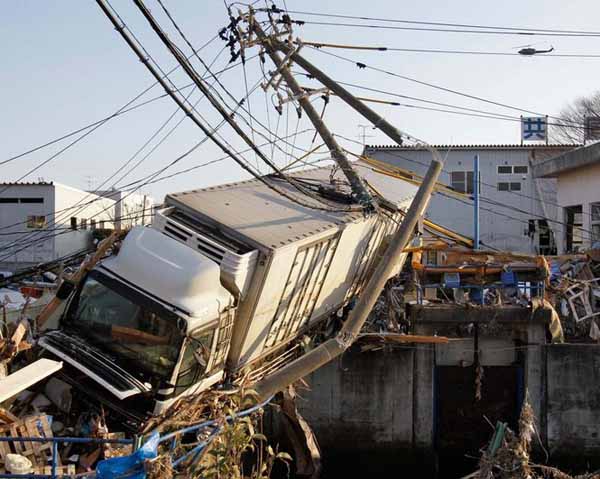
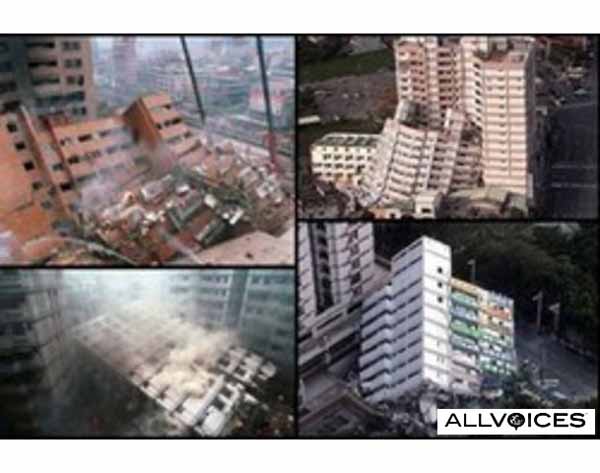
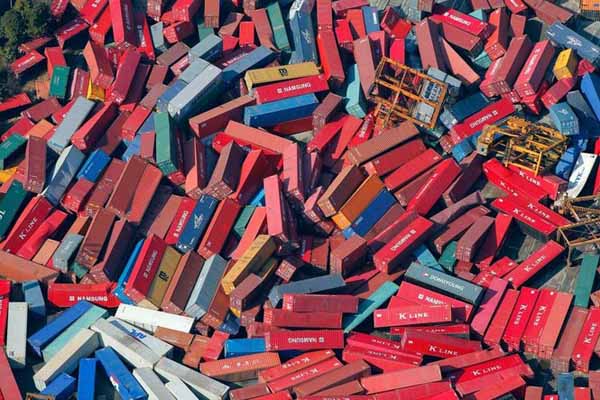
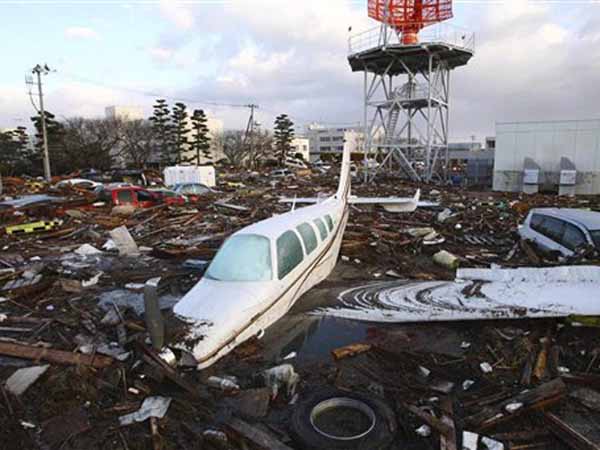
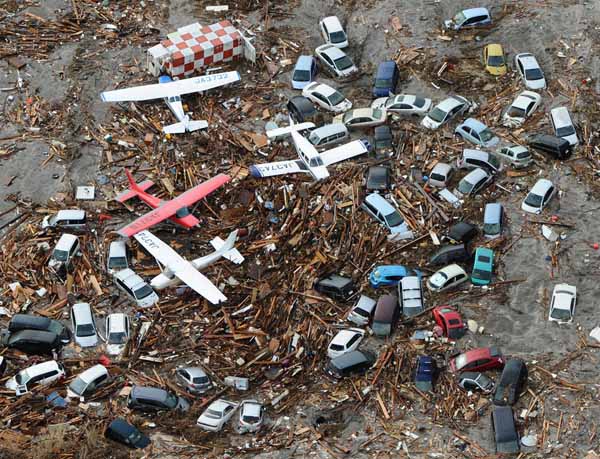
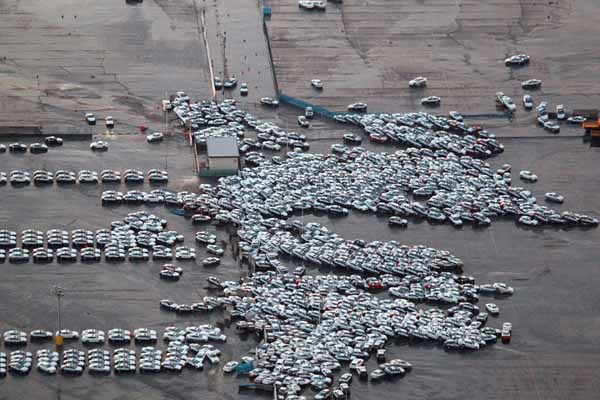
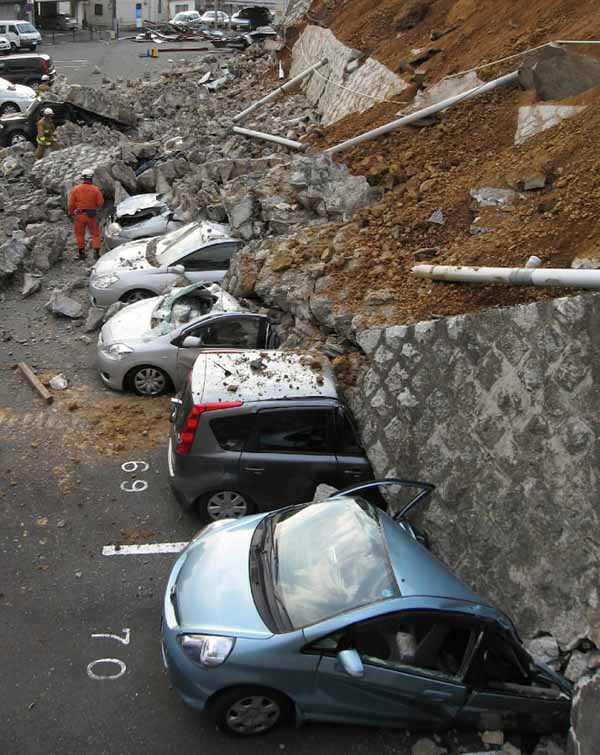
Shocking Photos from the 2011 Japan Earthquake and Tsunami.
(Click on the thumbnail below to view larger image)


 The
The earthquakes simce 1900.") The estimates of the Sendai earthquake's magnitude made it the most powerful earthquake to hit Japan and one of the five most powerful earthquakes in the world overall since modern record-keeping began in
The estimates of the Sendai earthquake's magnitude made it the most powerful earthquake to hit Japan and one of the five most powerful earthquakes in the world overall since modern record-keeping began in  The record of the
  This earthquake (gold star), plotted with regional seismicity since

 This earthquake was the result of thrust faulting along or near the convergent plate boundary where the Pacific Plate subducts beneath Japan. This map also shows the rate and direction of motion of the Pacific Plate with respect to the Eurasian Plate near the Japan Trench. Note that some authors divide this region into several microplates that together define the relative motions between the larger Pacific, North America and Eurasia plates; these include the Okhotsk and Amur microplates that are respectively part of North America and Eurasia.
The rate of convergence at this plate boundary is about
This earthquake was the result of thrust faulting along or near the convergent plate boundary where the Pacific Plate subducts beneath Japan. This map also shows the rate and direction of motion of the Pacific Plate with respect to the Eurasian Plate near the Japan Trench. Note that some authors divide this region into several microplates that together define the relative motions between the larger Pacific, North America and Eurasia plates; these include the Okhotsk and Amur microplates that are respectively part of North America and Eurasia.
The rate of convergence at this plate boundary is about  Shaded areas show quadrants of the focal sphere in which the
  Earthquake focal depths pick out zones of faulting passing from the ocean trenches down over 600 km into the mantle. These are called

 2.
2. 3.
3. 

 1. When the wave enters shallow water, it slows down and its amplitude (height) increases.
 2. This tsunami propagation forecast model shows the forecast maximum tsunami wave height (in cm). Ocean floor bathymetry affects the wave height because a tsunami moves the seawater all the way to the floor of the ocean.This led to a Pacific wide tsunami warning being issued.